Makina Blog
MoodWalkR: behind the scenes
Understanding how MoodWalkR computes pedestrian routes.
I have been working on a pedestrian routing application in the last months. It is called MoodWalkR and I invite you to look at the beta version, available for Toulouse, France. The main principles and motivations that guided me have been:
- using OpenStreetMap data;
- allowing a pedestrian to cross an open space;
- proposing different routes between two points depending on the user profile;
- keeping the interface really simple.
Routing is performed with PgRouting 2.0 to stay close to the database and geoprocessings. I explain some of the main features in this blog post.
Different routes according to the user preferences
Trying to understand how I do choose my own routes across the city, I have realised that it depends on the days: I am looking for shops and drinks on the weekdays, cultural or natural places on the weekend, and I even choose the shortest route when I am late to work. I have therefore chosen to create predefined profiles that will lead to computing different routes between the same points.
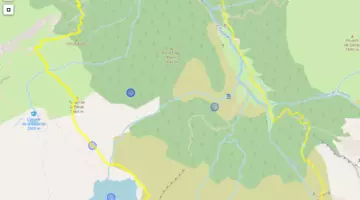
To achieve that, I use a 50-meter grid over the area. In each cell, about twenty OpenStreetMap features are analyzed, related to environment, transport, commercial activity and culture. They are combined and ponderated to get 3 ratings for each cell : Commercial activity, Nature and Culture. In the map below, you can see the ratings related to natural features.
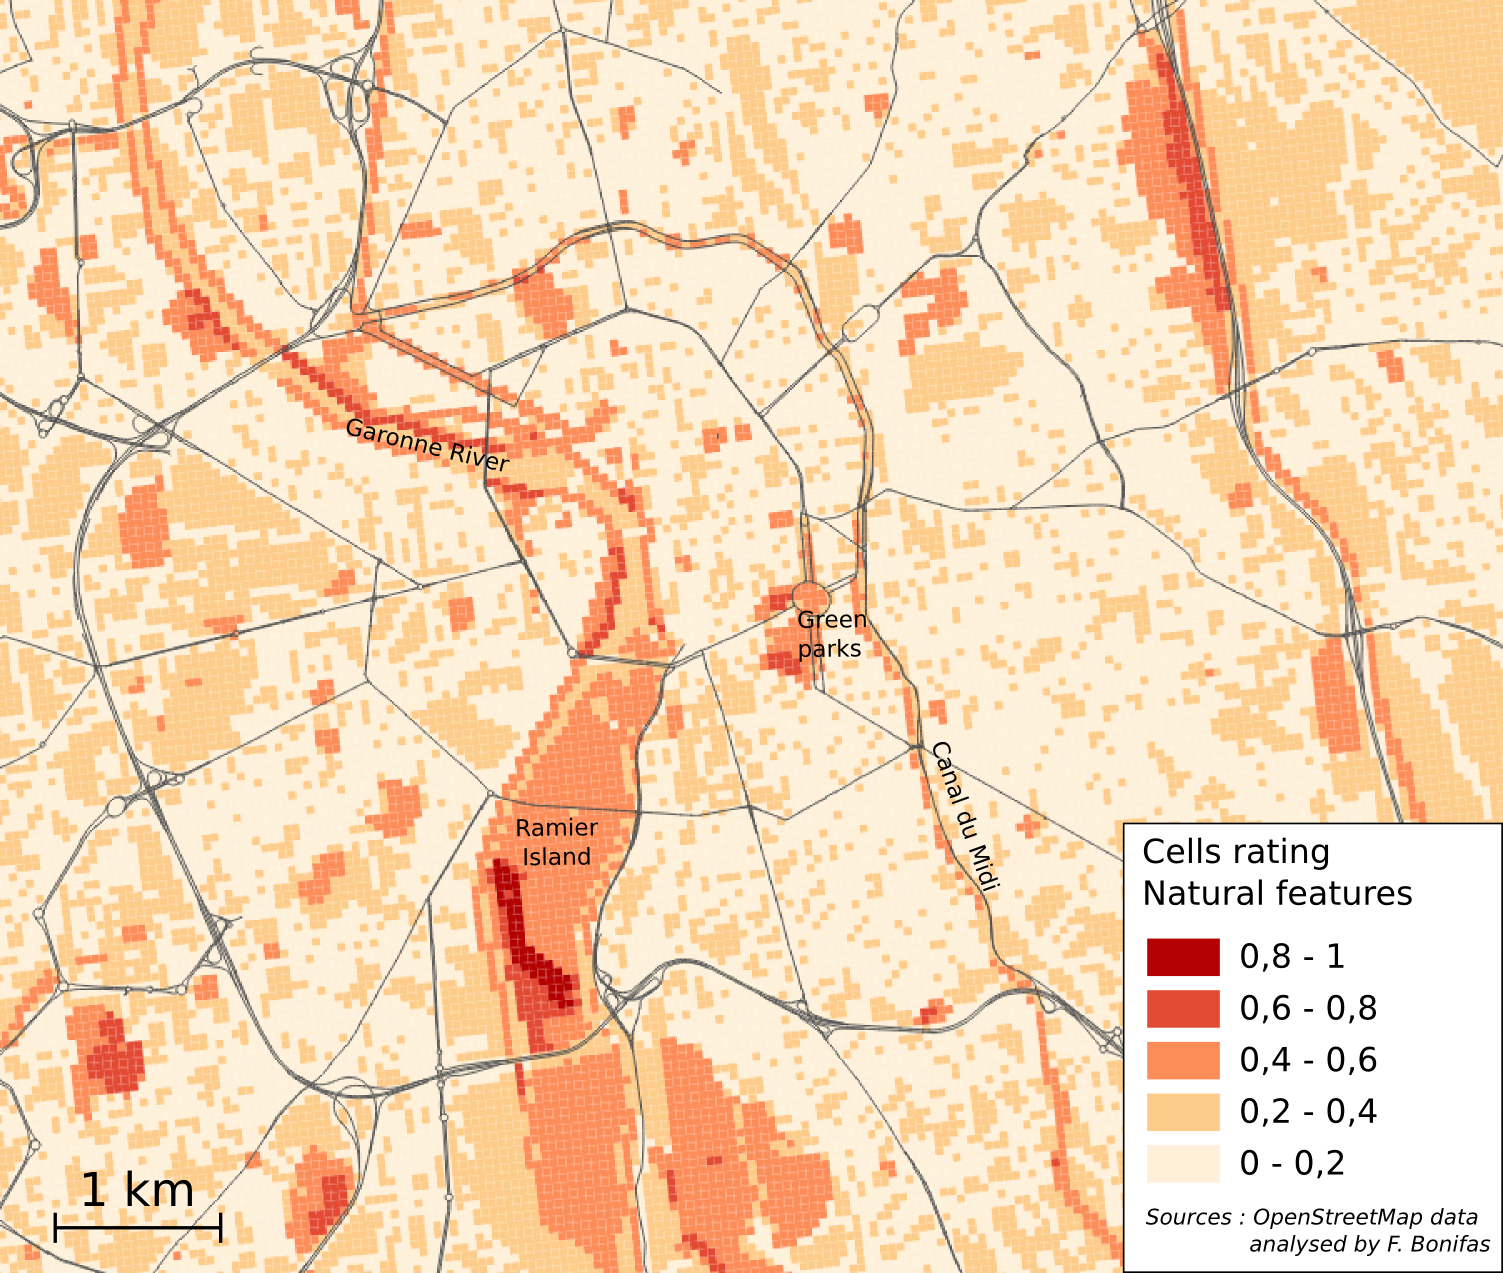
The road segments can now get 3 fictive lengths, for the 3 different profiles. These lengths are close to the geographical length of the road segment when it crosses cells with low ratings, and they decrease towards 0 when the ratings are high, i.e. near 1. Using a shortest path routing algorithm will so encourage going by cells with high ratings.
Crossing an open-space
Using the main routing applications available, I have always been frustrated not to be able to cross a square in diagonal. No, a pedestrian is not just another vehicle following a road network. To achieve crossing the plazas, I therefore pre-generate visibility graphs on the OpenStreetMap polygons representing pedestrian areas.
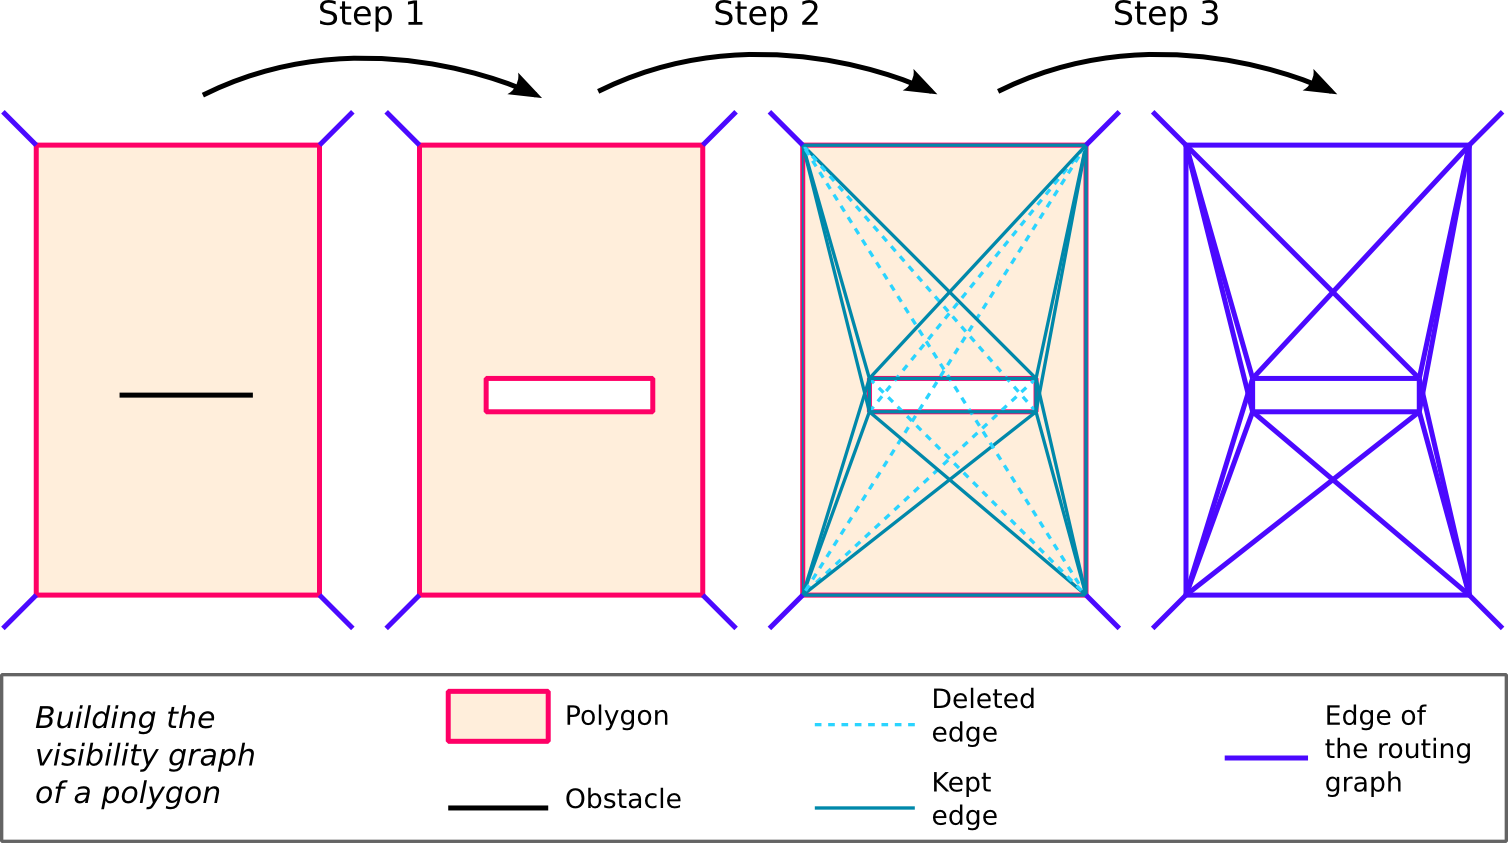
The process is the following and illustrated in the figure below:
- Step 1: the polygon is simplified by deleting some of its useless points for routing purposes. If an obstacle is inside the polygon, this becomes a hole.
- Step 2: the visibility graph between all points of the polygon. The are kept only if:
- they are not outside the polygon;
- they do not cross the polygon;
- they are not inside a hole of the polygon.
- Step 3: only valid routes are then merged with the global routing graph.
Circular routing
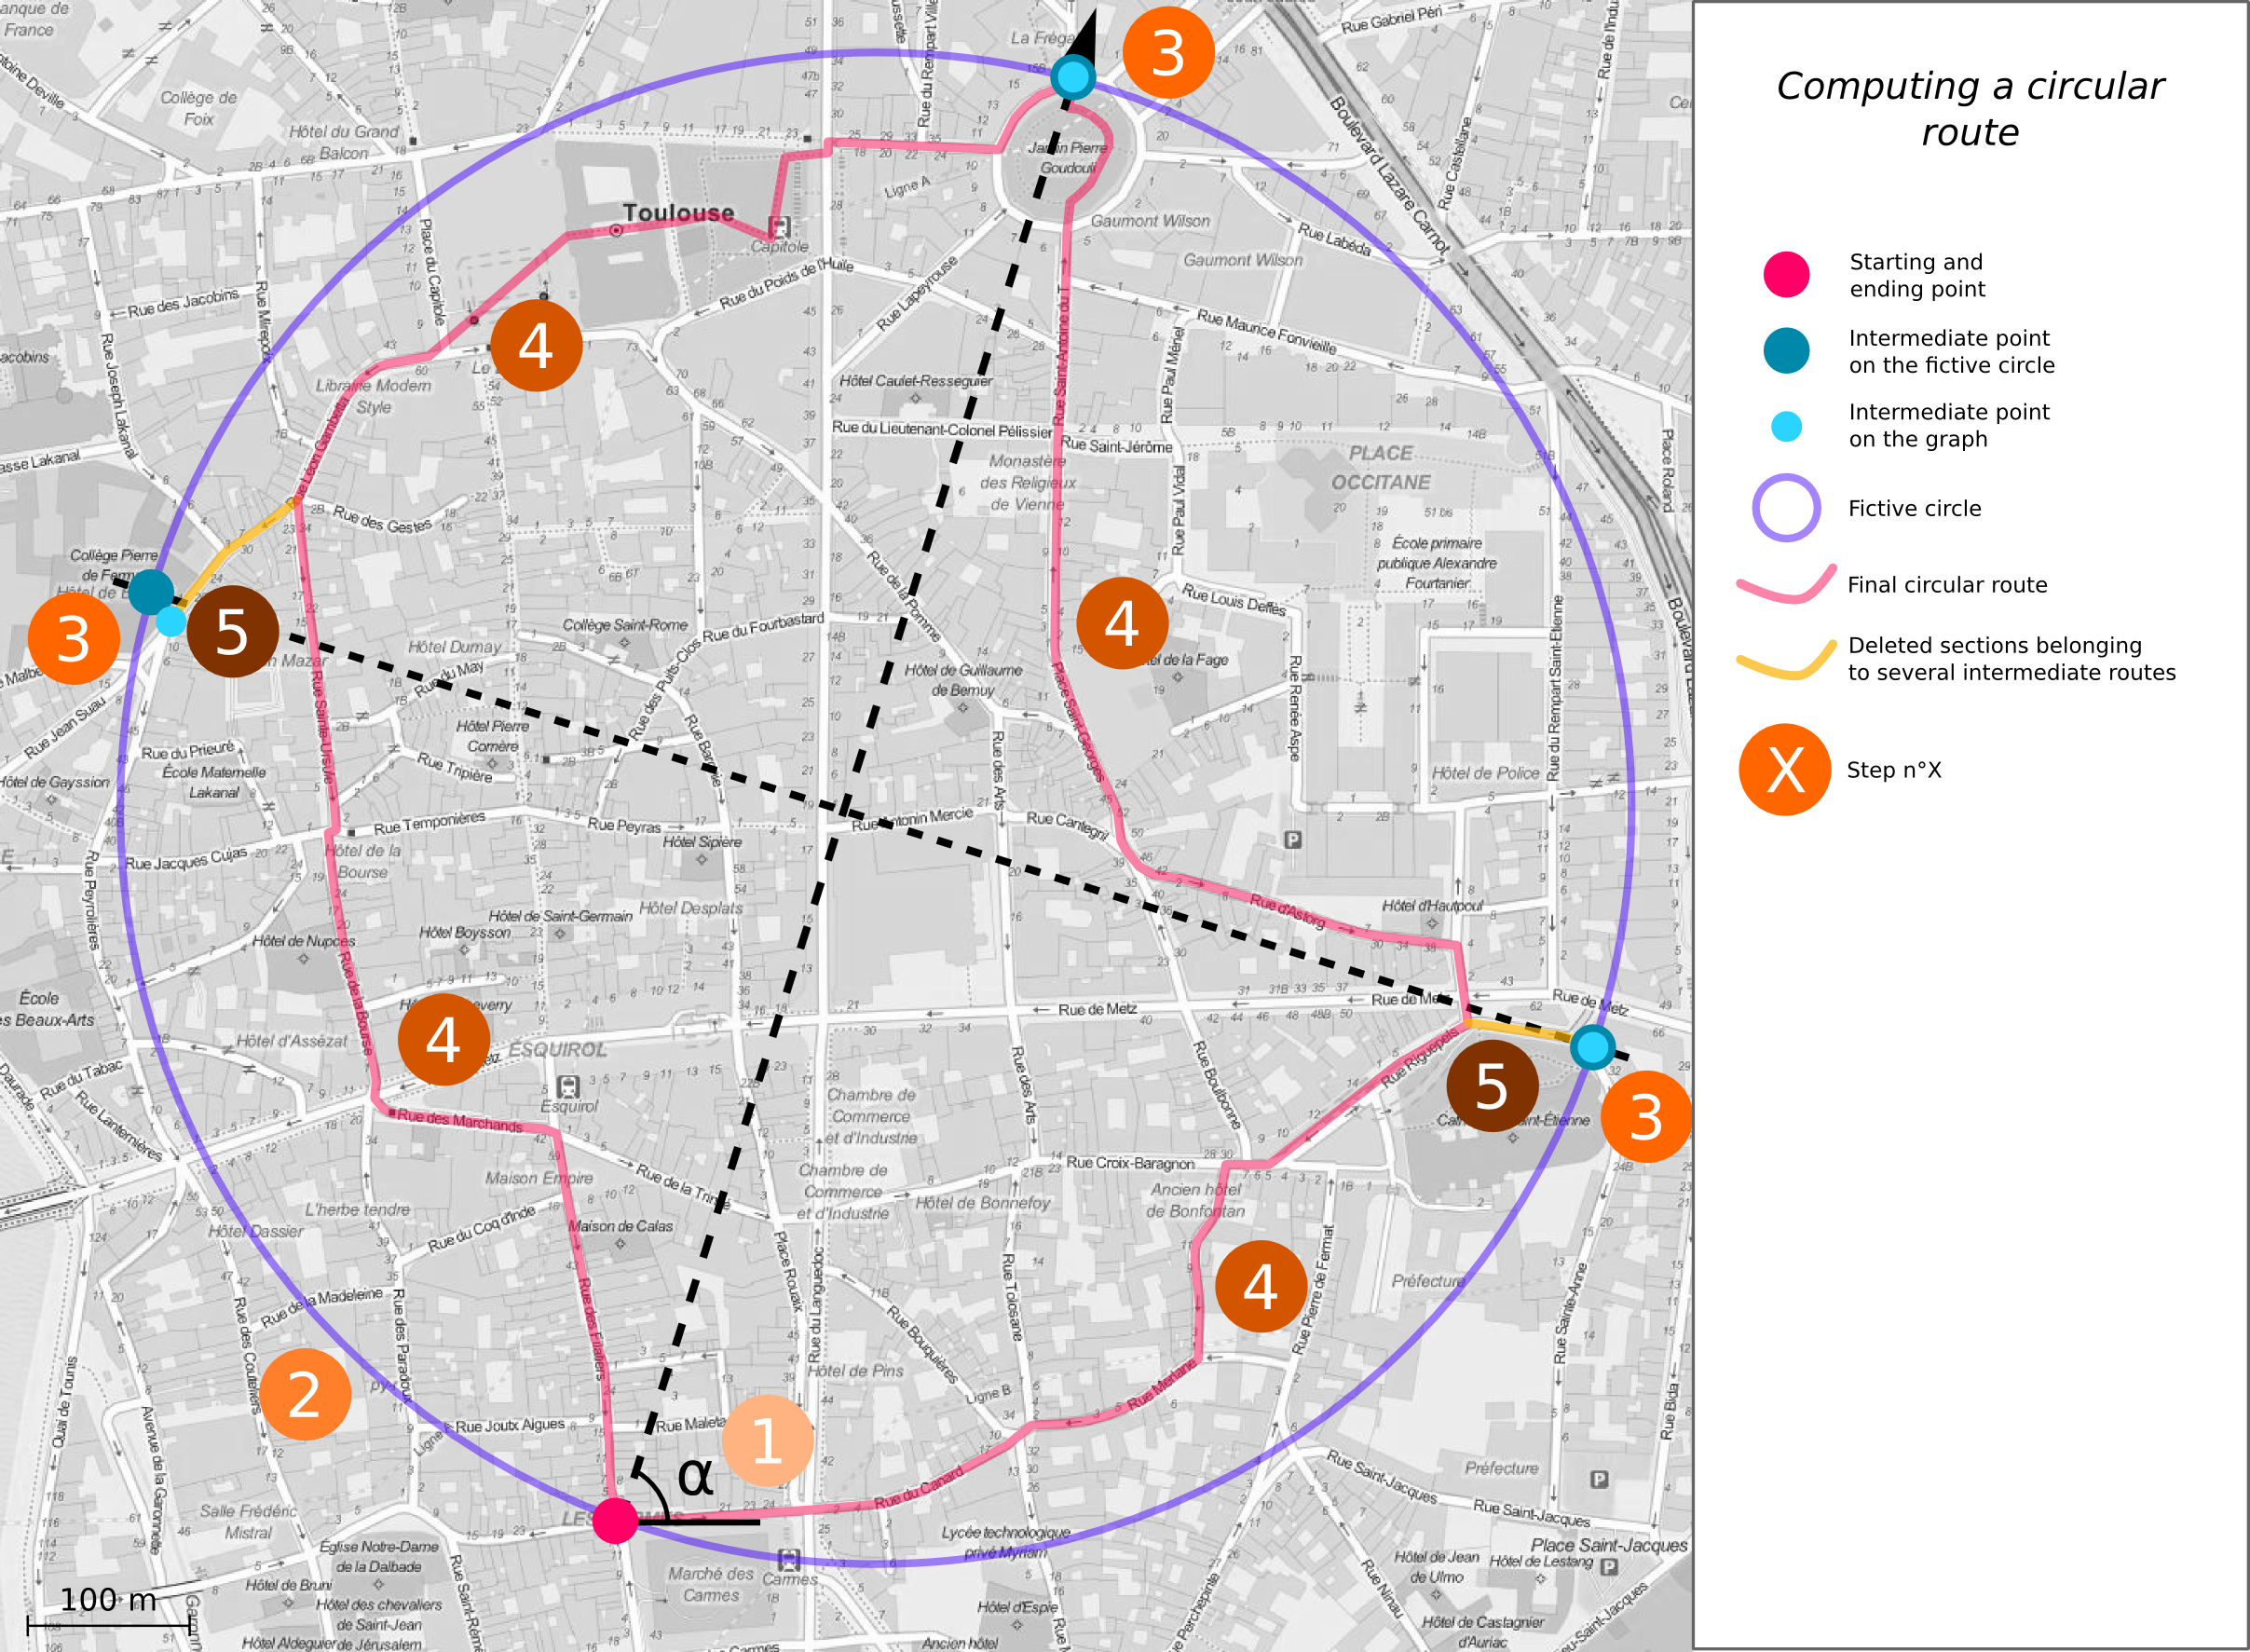
In order to help pedestrians to discover their cities, it seems interesting to suggest circular routes, would it be for running or simply walking. This is performed in several steps:
- Step 1: A random angle is chosen from the starting point. This allows to get new circular routes each time, even from the same starting point.
- Step 2: A fictive circle whose circumference is equal to the length chosen by the user corrected by a fixed factor is generated, from the starting point and in the the direction of the random angle.
- Step 3: Three intermediate points are put on the fictive circle and the nearest points on the routing graph are found.
- Step 4: Four shortest paths between the starting and intermediate points are computed, according to the walkability profile chosen by the user.
- Step 5: Overlapping sections are removed and the intermediate routes are merged to get the final circular route.
Formations associées
Formations SIG / Cartographie
Formation QGIS
Aucune session de formation n'est prévue pour le moment.
Pour plus d'informations, n'hésitez pas à nous contacter.
Voir la Formation QGISFormations SIG / Cartographie
Formation PostGIS
Toulouse Du 6 au 8 octobre 2026
Voir la Formation PostGISFormations SIG / Cartographie
Formation Leaflet
Nantes - Toulouse - Paris ou distanciel A la demande
Voir la Formation LeafletActualités en lien
Geotrek 2025–2026 : nouvelles fonctionnalités et grands chantiers à venir
Logiciel libre
27/05/2026
Geotrek et OpenStreetMap : Mise en place d’une passerelle pour une connaissance du territoire enrichie
Logiciel libre
08/09/2025
Installer Geotrek : avec ou sans segmentation dynamique ?
Logiciel libre
08/09/2025